Plimsol Lines and Finding the Thermocline
Part 3. The Narwhals' Tale of Rising Seawater and Sinking Ocean
What people do on the land affects the ocean. Cutting a forest removes a natural sponge and expedites more water flow to the sea. Removing concrete to plant a garden restores water retention and reduces runoff. Long showers or washing a car with a hose instead of using a bucket impact the surface waters of the Gulf of Maine in small, incremental ways.
Those who practice the dipstick science of taking a temperature only at the sea surface to assess ocean health, like a Fitbit on one’s wrist, are not going deep enough to know what is happening. It’s not temperature but water density that interests us.
The instrument to measure water density is a hydrometer. When a science teacher, my students made hydrometers by sticking a metal tack into the eraser at the end of a yellow pencil. With tack for ballast, the pencil floated upright in the water. Where the water met the air, the water line was marked on the pencil. Four glasses of clear water representing river, estuary, gulf, and ocean were measured. By noting the water lines drawn and how high or low the pencil floated, students could arrange the glasses from least to saltiest without tasting the water.
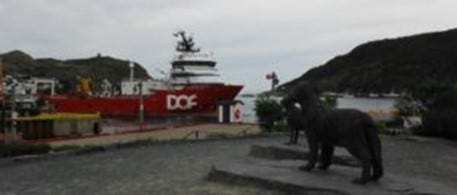
St Johns, Newfoundland, with newfie and black lab statutes.
On the waterfront, water line float markings can be found on the sides of ships. These marks are named for Samuel Plimsoll, who, in 1876, saw a bill passed through the British Parliament mandating reference marks be drawn to indicate the maximum depth that the vessel may be loaded with cargo. The water line must not be above the Plimsoll line, or the ship is at risk of sinking.
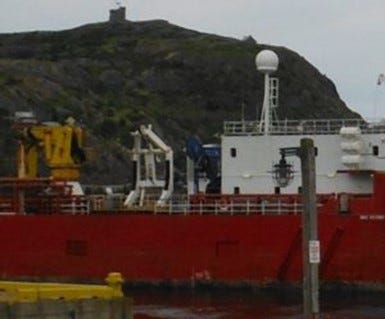
Plimsoll Lines in yellow, near the middle of the ship by the water.
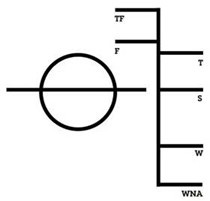
Plimsoll lines are a flag staff of multiple lines that look much like the float marks my students made on their pencils. Six lines are labeled with letters descending the ship’s side: TF for tropical fresh water, T for tropical ocean, F for fresh water, S for summer, W for winter, and WNA for winter North Atlantic. The National Ocean Service succinctly states, “A commercial ship is properly loaded when the ship’s waterline equals the ship’s Plimsoll line.”
Ships take on cargo and loads until the waterline meets the proper Plimsoll line. In St. Johns, Newfoundland, during the winter, cargo is loaded until the waterline reaches the lowest mark, WNA. The ship steams to a location one hundred miles offshore of Brazil, where the ocean is colored brown by the plume of fresh Amazon River water. The waterline at the highest Plimsoll line is TF for tropical fresh. The weight of the ship has not changed. The amount of freeboard changed as the density of seawater changed. Displacement of the ship went from riding high on the densest water in Newfoundland during the winter to floating low in the water where it was least dense in tropical fresh water.
A submarine diving down vertically through the water column will also pass through different water masses. The change in water density is sudden at the thermocline, so dramatic that sonar will not penetrate the boundary layer.
Sound emanating from within the water mass, say the call of a whale, reflects against the smooth thermocline with very little loss of energy to absorption. The water mass becomes a long-distance sound channel because sound waves never interact with the seafloor or ocean surface. Low-frequency sounds travel further than higher frequencies. Thus, a blue whale or fin whale singing at 20 hertz will have a greater range of communication than the minke whale with 80-hertz calls.
Finding the thermocline was perfected during World War II in the Straits of Gibraltar. Two currents flow between the Atlantic Ocean and the Mediterranean Sea. Mediterranean Outflow water is saltier and denser. It flows out under inflowing nutrient-poor Atlantic water, which is less dense even though it is colder.
The problem was that German submarines were passing Gibraltar undetected by turning off their engines, drifting in on Atlantic water, and out deeper down in the Mediterranean water. Setting off depth charges in one water mass would not damage submarines in the other. An instrument that would find the thermocline and identify the boundary between Atlantic Water above and Mediterranean Outflow below was needed.
Athelstan Spilhaus built the bathythermograph with much ingenuity. A copper thermo-coil unwounds with increasing temperature and wounds tighter when colder. A point was put on the end of the coil. To measure depth, small bellows contracted with increasing pressure. A glass slide that contracted with depth was mounted on the bellows. The slide was coated with a single layer of gold. The point on the thermo-coil was scribed through the gold when the coil moved with temperature, and the slide moved with depth.
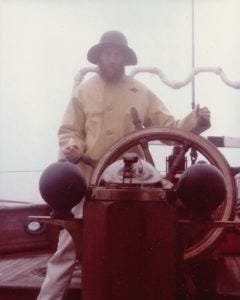
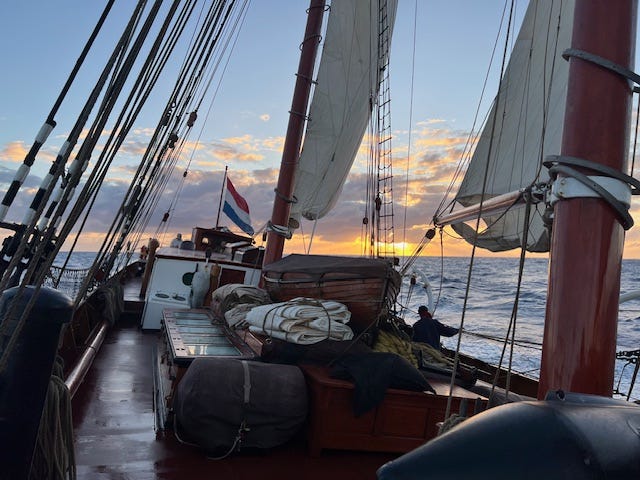
On the Research Vessel Westward, a 100-foot steel brigantine sailing ship out of Woods Hole, I was responsible for deploying the yellow torpedo-shaped device. The four-foot-long device was shackled to a wire. A small electric winch was bolted on the ship's deck near the back. The bathythermograph was lowered into the water. As it sank, the winch spun freely, whining for a set amount of time until I applied the brake. Pulling a handle to deploy the winch, a couple of hundred feet of wire was taken up, and the bathythermograph was lifted aboard. A curved flush two-inch metal plate was slid back, and the wet glass slide was pulled out. While often working on a heaving sea, one had to be very careful to hold the slide by the edges and not smudge the layer of gold on the glass slide. The slide was placed in a black metal viewer that was held to the light. It showed a squiggle line against a grid of temperature and depth.
Salinity is much more difficult to measure than temperature. A tall metal cylinder with valves top and bottom, called a Nansen bottle, was attached to the hydro-cable. Steel cable dipped in the ocean and subjected to sea spray, rusts easily. Menhaden oil is poured on to protect the cable as the wire drum spools out. A heavy brass messenger was slid down the wire to trip the open bottle. It flipped to close valves with its weight and capture seawater. The cable was wound in, and the bottle was detached by a brave soul leaning out on the “hero platform.”
The water went into the lab and was titrated. A reagent was carefully measured drip by drip into a beaker of stirring seawater until it suddenly went from clear to dark purple. After some calculations, the amount of reagent added worked out to the amount of salts in seawater, the salinity.
The life of an oceanographer mainly consisted of getting splashed by menhaden oil, watching water drip, and mixing up starch solutions at odd hours of the day when the galley kitchen was empty. Oceanographers were known by their silver-nitrate-stained fingers.
We reported the day’s measurements of sea temperatures and salinity over the radio at 6 a.m. Greenwich Mean Time, 1 a.m. local time. The government needed “surface truths” to calibrate its remote sensing instruments.
Yet, remote sensing can only report what is happening on the surface. Summer meltwater pooled on top of the Greenland ice sheet during the summer can be measured, but it is not known whether more or less than 50% flows away or refreezes back into the ice sheet.
We must go deeper to understand ocean motion and follow the thermohaline flow. Narwhals can assist us because they dive for halibut at the bottom of Baffin Bay and the Labrador Sea about twenty-six times daily.
Next: Part 4. Melting Arctic Sea Ice and Where Dark Grey/blue Water Meets Turquois
Clam Chowdah Narratives is a reader-supported publication. To receive new posts and support my work, consider becoming a free or paid subscriber.
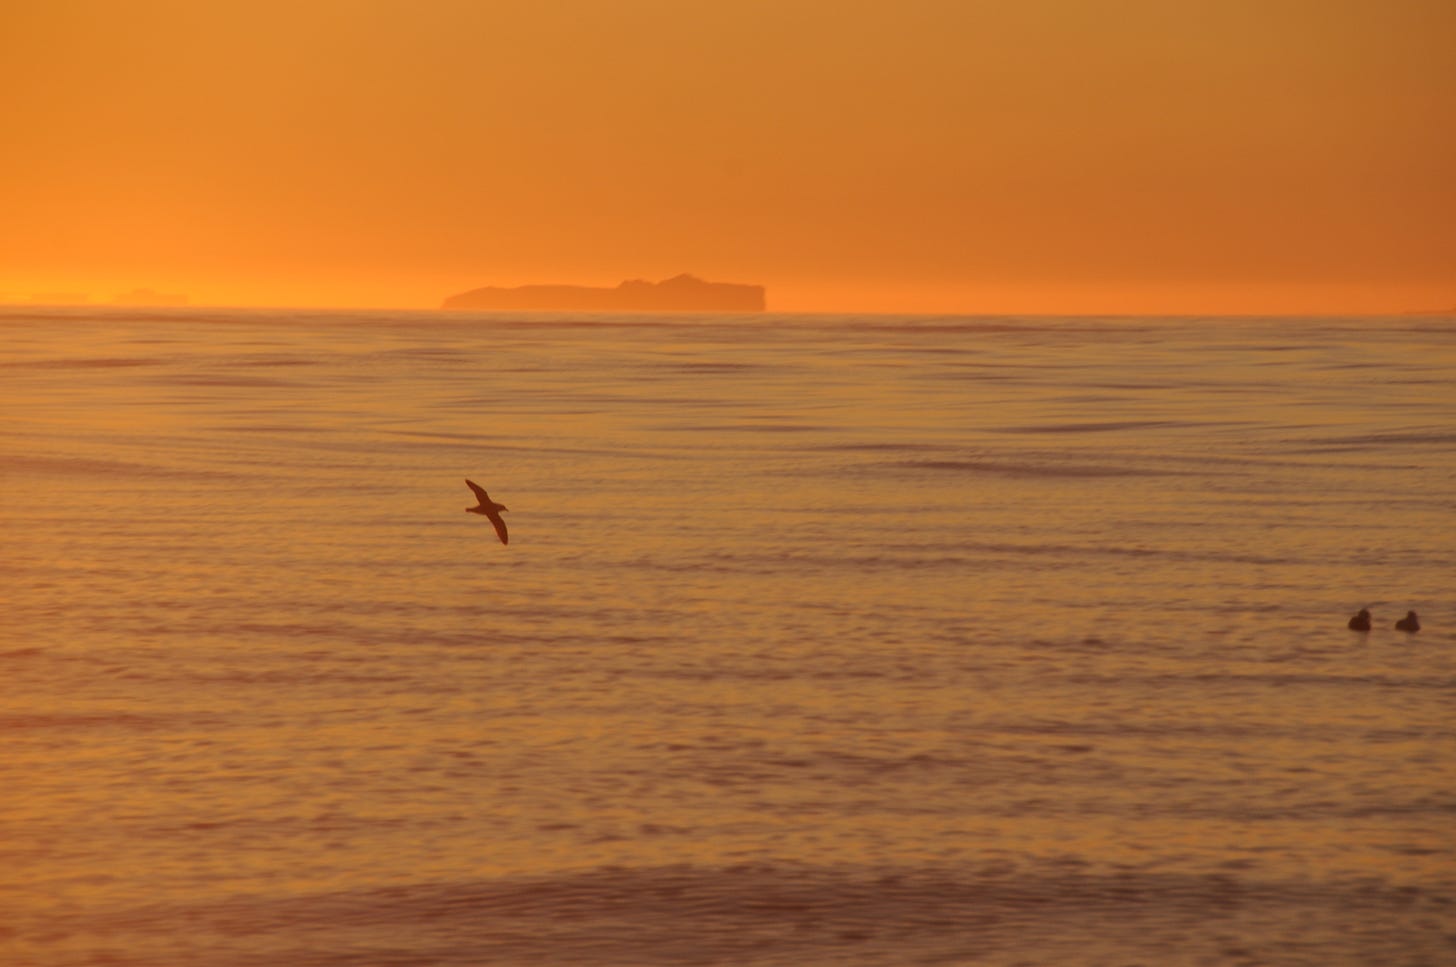
Fulmars and iceberg off Greenland during the twilight between sunset and sunrise.


This was really interesting. Enjoyed reading the history, and relevance of the research and work.